BAJAJ FINSERV DIRECT LIMITED

Our Products

Stocks Insights

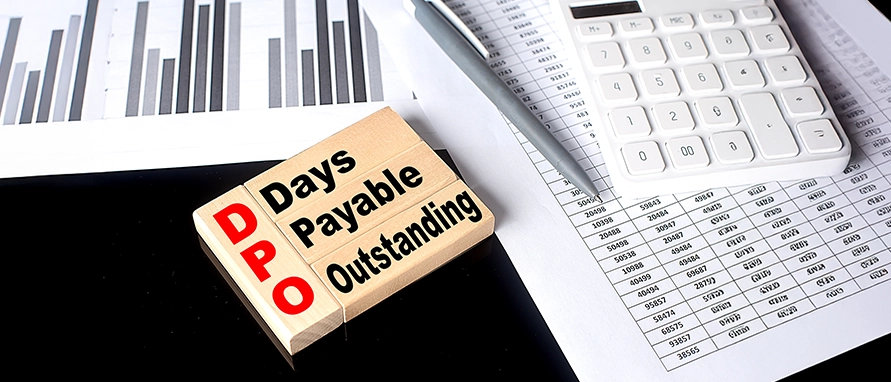
What Is Days Payable Outstanding (DPO)

authour img
Nupur Wankhede

Table of Contents

Learn how Days Payable Outstanding measures the average time a company takes to pay suppliers and what it reveals about cash flow efficiency.

Days Payable Outstanding (DPO) indicates how long a company takes to pay its suppliers after receiving goods or services. It reflects the firm’s payment practices and cash flow management. A suitable DPO level can support liquidity without straining supplier relationships.

Definition

Days Payable Outstanding (DPO) indicates the average number of days a company takes to pay its bills and invoices after receiving goods or services. It shows how effectively a business manages its accounts payable and cash outflows.

A higher DPO suggests the company is taking longer to pay suppliers — potentially conserving cash — while a lower DPO indicates faster payments, which may strengthen supplier relationships but reduce liquidity.

DPO Formula

The basic formula to calculate Days Payable Outstanding is:

  • DPO = (Average Accounts Payable ÷ Cost of Goods Sold) × Number of Days

Where:

  • Average Accounts Payable = (Opening A/P + Closing A/P) ÷ 2

  • COGS = Total cost of goods sold during the period

  • Number of Days = Days in the accounting period (usually 365 or 90 for quarterly analysis)

Example Calculation

If a company has:

  • Opening Accounts Payable = ₹4,00,000

  • Closing Accounts Payable = ₹6,00,000

  • Cost of Goods Sold = ₹36,00,000

  • Period = 365 days

Then,

Average A/P = (₹4,00,000 + ₹6,00,000) ÷ 2 = ₹5,00,000

DPO = (₹5,00,000 ÷ ₹36,00,000) × 365 = 50.7 days

This means the company takes about 51 days on average to pay its suppliers.

Using Average Accounts Payable

Using average accounts payable ensures accuracy by factoring in changes in payables over time. It smooths out short-term fluctuations and reflects consistent payment trends across the financial period.

Alternate / Per-Day Version

Some analysts use a daily version of the formula for quick analysis:

  • DPO = Average Accounts Payable ÷ (COGS ÷ Number of Days)

This approach divides daily cost of goods sold into average payables to estimate the number of days payable remain outstanding.

How to Calculate DPO: Step-by-Step

  1. Identify accounts payable balances: Gather opening and closing payables from the balance sheet.

  2. Compute average payables: Add the two and divide by 2.

  3. Find COGS: Extract the total cost of goods sold from the income statement.

  4. Apply the formula: Use DPO = (Average A/P ÷ COGS) × Number of Days.

  5. Interpret results: Compare with industry benchmarks to gauge efficiency.

Regularly tracking DPO could help identify liquidity trends and optimise supplier payment terms.

Average Days Payable Outstanding

Average DPO represents the mean time taken to settle obligations over multiple accounting periods.

It’s particularly useful for evaluating long-term cash management practices and monitoring improvements in working capital efficiency.

For example, a reduction in DPO over several quarters may indicate tighter cash flow or stricter supplier terms, whereas an increase might suggest deliberate payment deferral to preserve liquidity.

Interpretation & Benchmarks

Interpreting DPO effectively requires context — a high or low value isn’t inherently good or bad.

1. High DPO:

  • Indicates delayed payments and improved short-term liquidity.

  • May strain supplier relationships if excessive.

2. Low DPO:

  • Reflects prompt payments and strong supplier goodwill.

  • May reduce available cash for operations.

Typical Industry Benchmarks:

Here’s how payment timelines differ across sectors, influenced by industry practices, supplier relationships, and cash flow dynamics.

Industry Average DPO (Days) Notes

Retail

35–50

Short cycles; frequent purchases

Manufacturing

50–70

Dependent on credit terms and volume

Technology / SaaS

30–45

Low inventory levels, quick cash turnover

Automotive

60–90

Long supply chain and bulk contracts

FMCG / Consumer Goods

40–60

Driven by supplier credit policies

Limitations

While DPO is insightful, it should not be analysed in isolation.

Limitations include:

  • It may not reflect differences in supplier payment terms.

  • Seasonal fluctuations can distort averages.

  • A high DPO might signal liquidity stress rather than efficiency.

  • It doesn’t account for discounts lost due to delayed payments.

For a clearer picture, combine DPO analysis with Days Sales Outstanding (DSO) and Days Inventory Outstanding (DIO) to compute the Cash Conversion Cycle (CCC).

Conclusion & Key Takeaways

The Days Payable Outstanding (DPO) metric helps businesses understand how efficiently they manage payables and cash flow.

Maintaining an appropriate balance helps support supplier relations while preserving liquidity.

Key Takeaways:

  • DPO measures the average time taken to pay suppliers.

  • The formula: (Average A/P ÷ COGS) × Number of Days.

  • A high DPO improves liquidity but may affect credit terms.

  • Benchmarking against industry peers provides clearer context.

  • Appropriate DPO levels align with both operational needs and supplier expectations.

Disclaimer

This content is for informational purposes only and the same should not be construed as investment advice. Bajaj Finserv Direct Limited shall not be liable or responsible for any investment decision that you may take based on this content.

FAQs

How is Days Payable Outstanding (DPO) calculated?

Days Payable Outstanding (DPO) is calculated using the formula (Average Accounts Payable ÷ Cost of Goods Sold) × Number of Days. It measures the average time a company takes to pay its suppliers after receiving goods or services.

The DPO formula reflects the relationship between accounts payable, cost of goods sold, and the time period being assessed. It indicates how efficiently a business manages its short-term obligations and cash outflows to suppliers.

DPO varies widely across sectors depending on operating models and supply chain structures. Manufacturing and capital-intensive industries often record higher DPOs due to longer production cycles and larger purchase volumes, whereas service-based companies generally maintain shorter payment periods.

DPO has limitations as it does not account for variations in supplier terms, early payment discounts, or negotiated credit conditions. Relying solely on DPO can overlook liquidity nuances and operational risks linked to payment practices.

View More
Hi! I’m Nupur Wankhede
BSE Insitute Alumni

With a Postgraduate degree in Global Financial Markets from the Bombay Stock Exchange Institute, Nupur has over 8 years of experience in the financial markets, specializing in investments, stock market operations, and project management. She has contributed to process improvements, cross-functional initiatives & content development across investment products. She bridges investment strategy with execution, blending content insight, operational efficiency, and collaborative execution to deliver impactful outcomes.

Academy by Bajaj Markets

eye icon 66748
share icon

All Things Credit

Unlock the world of credit! From picking the perfect card to savvy loan management, navigate wisely.

Seasons 12
Episodes 56
Durations 3.0 Hrs
eye icon 43401
share icon

Money Management and Financial Planning

Money Management and Financial Planning covers personal finance basics, setting goals, budgeting...

Seasons 5
Episodes 19
Durations 1.1 Hrs
eye icon 19776
share icon

The Universe of Investments

Explore the investment cosmos! From beginner's guides to sharp-witted strategies, explore India's treasure trove of options.

Seasons 5
Episodes 23
Durations 1.5 Hrs
eye icon 34687
share icon

All Things Tax

Navigate the tax maze with ease! Uncover Income Tax 101, demystify jargon with Terms for Beginners, and choose between Old or New Regimes.

Seasons 6
Episodes 25
Durations 1.3 Hrs
eye icon 3268
share icon

Insurance Handbook

Discover essential insights on various types of insurance in India.

Seasons 2
Episodes 6
Durations 0.5 Hrs
eye icon 4394
share icon

Tech in Finance

Welcome to Tech in Finance, where we explore the exciting intersection of technology and finance...

Seasons 1
Episodes 5
Durations 0.3 Hrs
Home
Home
ONDC_BD_StealDeals
Steal Deals
Free CIBIL Score
CIBIL Score
Free Cibil
Accounts
Accounts
Explore
Explore

Our Products